

Summary: A look at the U.S. Census Bureau 2018 estimates for the Pittsburgh Metropolitan Statistical Area (MSA) and Allegheny County which show another year of population decline.
Based on the Census population estimates as of July 1, 2018, the seven-county Pittsburgh MSA (Allegheny, Armstrong, Beaver, Butler, Fayette, Washington and Westmoreland) had 2,324,743 people. Compared to July 2017, population in the MSA fell by 5,540 people, or 0.2 percent. Compared to the nine metro areas with a similar population to Pittsburgh (2 to 2.5 million) only Cleveland saw a decrease from its 2017 reading.
Components of population change of a specific geographic area include natural increase (births minus deaths) along with net migration (net domestic migration plus net international migration). These are totaled along with statistical anomalies for demographic events that cannot be accounted for—what the Census Bureau refers to as a residual—to produce a population change value.
Two counties in the region, Butler and Washington, had population increases from their 2017 estimates. In both counties the rise was a result of positive net migration more than offsetting losses due to more deaths than births. Butler County had the largest overall population gain and the largest net migration gain in the MSA with 72 international migrants and 987 domestic migrants. All seven counties had natural losses with deaths exceeding births. Westmoreland County had the greatest loss at 1,624 with just 2,829 births compared to 4,453 deaths. In Allegheny and Armstrong counties the population losses due to net out migration exceeded the losses resulting from deaths exceeding births.
2017 to 2018 Population Change, Pittsburgh MSA
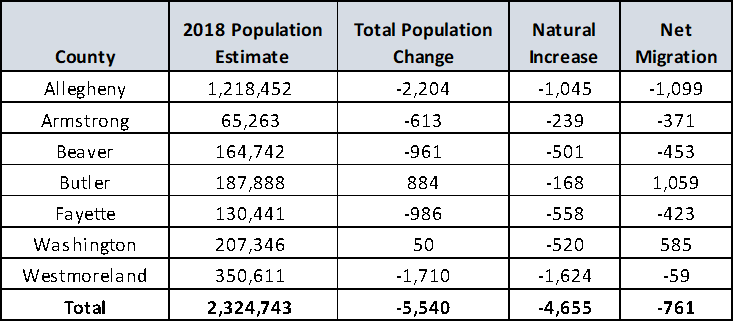
Allegheny County with its 1,218,452 residents accounts for more than half of the MSA’s population. The county lost 2,204 people (0.2 percent) between 2017 and 2018, accounting for just over a third of the MSA’s overall decline. There were 12,795 births but those were exceeded by 13,840 deaths. Net international migration was a positive 3,105 but net domestic migration was a negative 4,204. In historical terms the county’s current population estimate is roughly where it stood between 1920 and 1930 but far below its peak of 1,628,587 in 1960.
An Allegheny Institute 2007 report on Allegheny County’s population losses argued that the availability of quality, good-paying jobs and the quality and cost of living were key factors in an area’s attractiveness. That is just as true today. Economic factors, specifically jobs and the business climate that produce the job gains remain the keys to luring new residents and encourage existing ones to stay.
The public policy changes recommended in that report, many of which had to come from Harrisburg—such as ending teacher and transit strikes, prevailing wage and binding arbitration reform, stopping economic development subsidies and putting all tax increases on the ballot for voter approval—have sadly not come to pass. Instead there is even more emphasis locally on government-driven development (note that in Westmoreland County a community development official mentioned an amphitheater as a way to reverse population losses). Ending public sector union strikes are not even being proposed let alone being voted on. And taxpayers are no closer to having the right to vote to approve all local tax increases.
The 2007 report noted that property taxes in Allegheny County were much higher than in neighboring counties and may have an impact in attracting and keeping residents. Since 2007 Allegheny County and Washington County have undergone countywide reassessments and both have comparable base year valuations (100 percent pre-determined ratio of assessed-to-market value in 2012 and 2015, respectively). Currently, the combined millage rate (county, municipal and school) in Upper St. Clair (34.42) is twice that of Peters (17.55), two communities that border each other in the separate counties.
Thus, someone considering a property that is assessed at $150,000 in one of the two municipalities would see a difference in total taxes of just over $2,500 more in Allegheny County, with $1,800 of that resulting from the difference in school taxes. Or said another way, at current millage rates a property with an assessed value of $295,000 could be purchased in Peters with the same total tax bill of a $150,000 assessed property in Upper St. Clair. Perhaps part of the migration figures for the two counties is reflective of the wide differences in taxes.
Based on data from the 2010 Census—when the MSA population was 2,356,285, or 31,542 higher, and Allegheny County’s population was 1,223,348 or 4,896 higher—the years of increases or negligible losses lasted until about 2013. Since then population in the MSA and Allegheny County have fallen each year. That has implications for labor force, tax base and political representation as the 2020 Census approaches.
While there are areas of modest strength in the MSA, there can be no gainsaying the fact that, overall, the county and region are losing ground relative to the country and many comparably sized metro areas. This, despite the region’s great good fortune of being a major beneficiary of having natural gas deposits.